Optimizing CX Programs Within Insurance and Financial Services
by Fred Gaudios
Over the past decade-plus, I’ve led and directed several CX research programs in insurance and financial services. They’ve been successful at explaining the strengths and opportunities companies offer their customers (whether B2B, B2B2C, or B2C) and have added significant value to the client company. But, as in everything, there’s more to learn from the challenges than from when everything runs smoothly!
In my experience, I’ve noticed that these CX research programs can grow stagnant over time. This can be attributed to the fact that these programs are inherently more complicated than programs in different verticals which may have only one or two layers of “customers.” As B2B2C (at minimum) businesses, insurance and financial services companies face unique challenges in accurately measuring the customer experience and tracking changes over time – especially when clients choose to be measured against the competition.
The following are some of the common challenges that have been uncovered over the years, along with their potential solutions. We don’t want to give the impression that these programs are flawed – quite the opposite, in fact – these are simply suggested ways that we can think differently about the response patterns we receive to provide a more holistic and, ultimately, actionable view of the customer experience.
CHALLENGE #1:
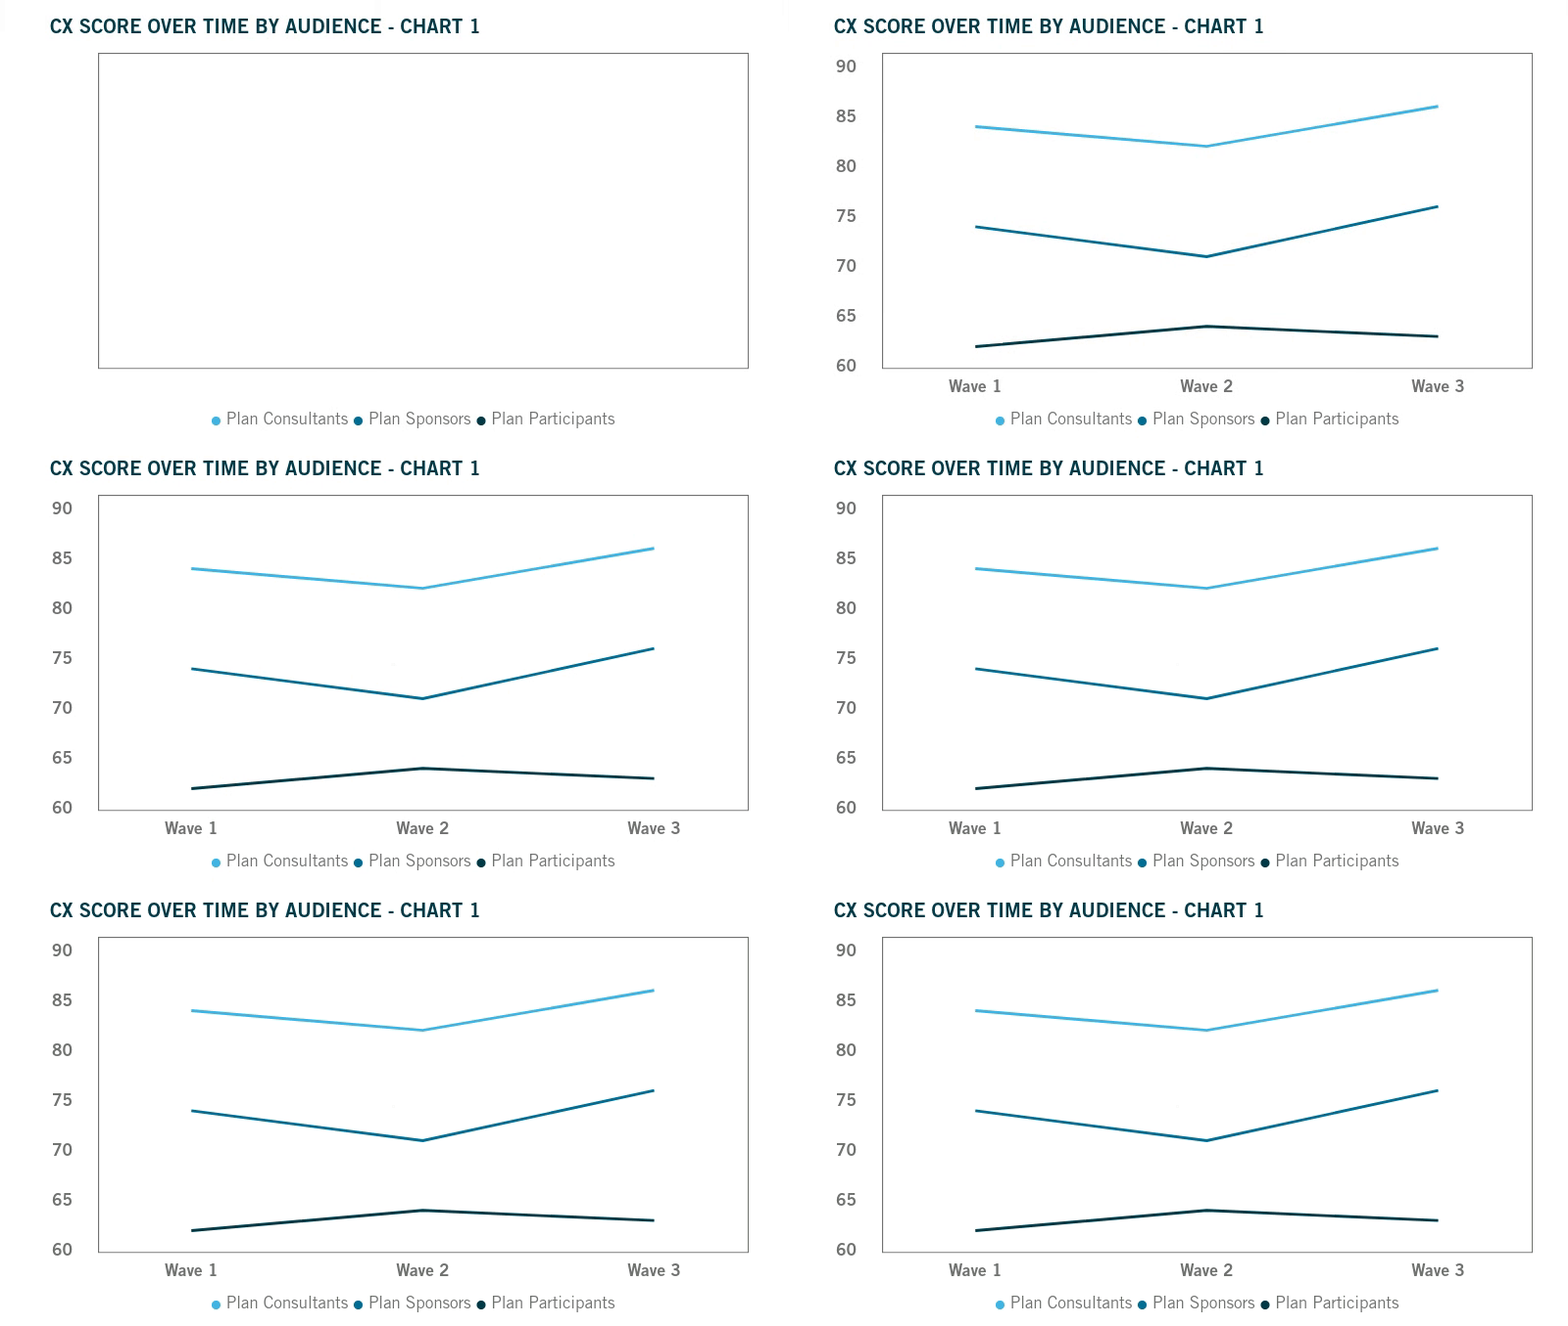
For programs with multiple audiences (e.g., brokers, employers, and end customers), CX scores are fundamentally different across audiences, implying a weaker relationship with one audience versus another and leading organizations to ask questions such as, “What can we do to improve the [AUDIENCE] experience?”
FOR EXAMPLE, a retirement plan provider might measure CX across three different audiences – plan consultants, plan sponsors, and plan participants – and find a pattern where plan consultants have the highest CX score, followed by plan sponsors, and then by participants. It might look like the chart below, assuming scores collected over three waves:
This can sometimes lead to a reallocation of resources toward the lower-scoring audience (at the expense of higher-scoring audiences), with varying results.
SOLUTION #1:
The most common response I’ve seen to this type of challenge is conducting follow-up qualitative with each audience to address unique pain points and identify triggers that might cause a lower CX score for one audience over another. This is a great solution and many companies have found success with this approach! However, what if the audiences are providing different CX scores – not because they are more (or less) satisfied with the client company – but due to something inherent in who they are as an audience?
For instance, in the example above, plan consultants might be closer to your organization than the plan sponsors. Plan sponsors may also be closer to your organization than plan participants, and therefore are more likely to provide a higher CX score. In this case, how do you compare apples to apples?
Well, there are some advanced analytical techniques which might add value – without the same level of additional cost as qualitative follow-up:
- Non-responder modeling is a technique that helps companies understand how response and non-response bias impact ratings for each audience. Perhaps in the example above, plan consultants who are satisfied with their relationship are more likely to respond to a survey because they have a vested interest in continuing the mutual relationship, whereas plan participants who are dissatisfied are more likely to respond to a survey because they want their voice heard and changes made to serve them better. Conducting this analysis might provide a more holistic picture of each audience’s customer experience. As consultants, we always encourage this sort of deeper exploration to understand the real base of customer whose perceptions and sentiments we have reflected in quantitative research results. This insight can help us configure our set of listening posts to represent the full base of customers.
- Propensity modeling helps companies understand how likely different customers are to take specific actions (like leave, or shop/RFP their business) at a specific CX score level. Through these techniques, you might learn that someone in one audience with a 65% average CX score is in practice less likely to switch their business than someone in a different audience with a 75% average score.
With either solution, you can dig deeper than aggregated CX benchmark scores and have an auxiliary measure that is linked to behaviors that matter. The CX score provides a subjective, emotional benchmark, while the predicted behaviors from the above-mentioned analyses provide a quantifiable impact score.
(As an aside, we have sometimes found that businesses can get lost in aggregated benchmark metrics, such as CX scores, and lose track of the specific pain points for each audience, which is where we ultimately find the requirements needed to build a better customer experience. In other words, it might matter less if satisfaction is higher for one audience versus another, if you have identified the pain points for each audience and are acting on those insights to move each of the benchmark scores.)
CHALLENGE #2:
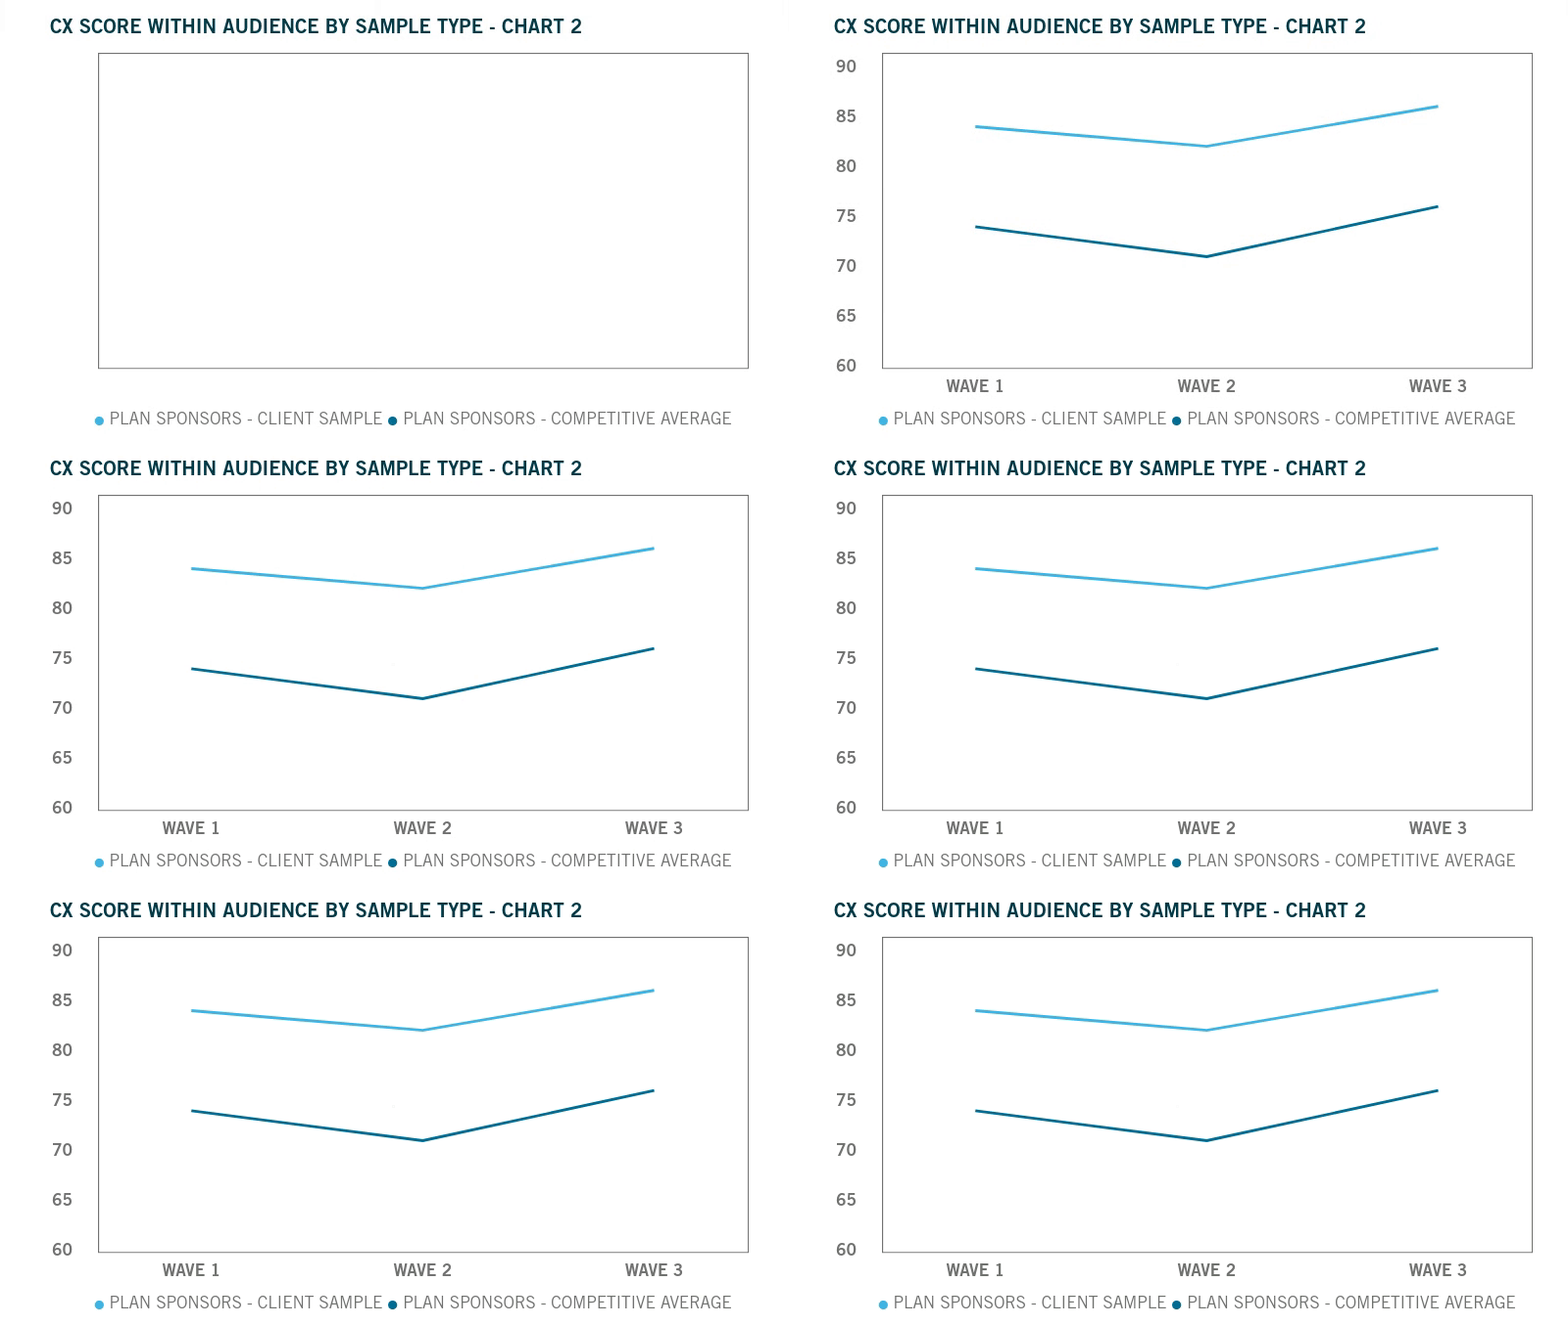
For programs that include both a competitive and customer audience (i.e., capturing competitive intelligence alongside results from the client’s direct customers), scores can be different by sample source within each audience, implying client company strengths (or weaknesses) relative to the competition which might or might not be accurate.
FOR EXAMPLE, the same retirement plan provider mentioned above might collect data from plan sponsors who work with them, as well as the competition, using a panel to collect competitive responses. Over three waves of data collection, it might look like the chart below:
SOLUTION #2:
Assuming a different survey experience for competitive panel sample (unbranded survey experience) and client sample (branded survey experience), companies should consider an oversample of their own customers within the unbranded panel survey experience to determine a potential sponsorship effect. The sponsorship effect can account for the likely higher positivity seen across all metrics in branded surveys due to the interviewing of current customers.
This will help correct for any artificial response or positivity bias among your customers, who may be more likely to participate when they’ve had a recent positive experience with your brand. The sponsorship effect can be used either informally (for example, 10% more positive or 10% more negative) or formally (adjusting client sample numbers by the sponsorship effect to match current customers’ feedback in the unbranded panel survey).
As an alternative, it’s also reasonable to move forward with the understanding that different scores have different comparative benchmarks. Client samples are intended to define pain points, create solutions, and track successes; with these scores, the relative comparison becomes a historical trajectory. Competitive samples are intended to benchmark against the competitive landscape to help your business extend advantages and/or close gaps. While sponsorship effects might be helpful, it’s also perfectly okay to frame different results in different contexts, particularly given the different sample sources and survey experiences discussed above.
Regardless, it’s important to have confidence in your panel and research partners, especially for B2B audiences where sample is more expensive. Consider partnering with a research company that has expertise in sampling and sample management.
CHALLENGE #3:
Hypothesized “moments of truth” in the customer journey (e.g., disability claims in the non-medical space, moments of financial hardship in the 401(k) plan provider space) are difficult to capture in an annual or bi-annual tracking survey, due to low incidence and/or difficulty identifying the specific target time it takes place.
SOLUTION #3:
Where moments of truth are lower incidence, such as the disability claims example above, consider a specific and transactional follow-up survey. Event-triggered surveys, which are conducted on a monthly or quarterly basis if volume is sufficient to conduct 100-150 surveys per epoch, can be very helpful in this respect. Also, consider phone instead of – or in addition to – online research. While the industry has largely moved to online research over the past ten years, claims and financial hardship (the two examples above) are sensitive topics. A skilled professional telephone interviewer can not only improve response rate, but also obtain deeper insights compared to an online survey. Qualitative methods, such as individual interviews or online bulletin boards into moments of truth, can be helpful here as well.
Where moments of truth are common but difficult to identify, consider whether it’s possible to find related behaviors that map to the moment of truth, such as reducing contributions in a time of financial hardship. Also consider the absolute necessity of capturing feedback from your customers vs. leveraging an unbranded survey with an oversample of your own customers through the panel sampling – these experiences can sometimes be sensitive, and you might not want to ask your customers about them in a company-branded survey.
As mentioned earlier, there are real benefits to conducting panel research to measure CX in insurance and financial services from a data integrity perspective. Plus, in this instance, it’s far less burdensome to ask panelists whether they’ve recently experienced financial hardship (or filed a claim) than it is to ask current customers. While there are some legitimate concerns around panel quality, partnering with a research provider who maintains active relationships with companies leveraging proven, proprietary panels can optimize your research experience and provide confidence in your data.

As Vice President, Client Services at Burke, Fred continues to build his practice as an insurance and financial services researcher and thought leader. He has designed multiple successful CX programs within these industries since he started his research career in 2006.
Interested in reading more? Check out more from Fred:
Top Takeaways from Quirk’s New York
As always, you can follow Burke, Inc. on our LinkedIn, Twitter, Facebook and Instagram pages.
Source: Feature Image – ©apichon_tee – stock.adobe.com


