Segmenting Key Drivers: Addressing the Individuality of Your Customers
by Mike Deinlein
As insights professionals, we understand that not all consumers or customers are the same. They have unique needs, behaviors, or attitudes that influence how they interact with a certain business, product, or service. Yet, more often than not, we sometimes ignore the nuance and distinctiveness between customers when we tackle Key Drivers Analysis (KDA) in large-scale tracking programs. While this has its benefits – namely, clear recommendations on where to focus resources – an over-reliance on an aggregate KDA built for the “average” customer can obscure the foundational understanding that all customers are unique.
Key Drivers Analysis attempts to answer the single most important question for a customer experience researcher – “where should I invest my money to make the most positive impact for our customers?” It illuminates the relative importance of potential drivers on an outcome – Net Promotor Score (NPS), Overall Customer Satisfaction (OSAT), Customer Effort Score (CES), or a specific behavior – so companies can better direct resources to the areas that matter most. This is a novel goal and when done well, a Key Drivers Analysis can help businesses plan strategically and achieve a healthier return on their Customer Experience (CX) investments. However, such a lofty goal is sure to drive a multitude of opinions on the best approach to KDA. While one researcher may prefer correlation for the simplicity in aligning stakeholders, another prefers partial least squares regression for the storytelling potential, and yet another researcher prefers the most cutting-edge machine-learning technique for the highest possible predictive power. There is no easy answer to the best technique for KDA, but there still might be an answer to the best approach to KDA.
No matter what tool a researcher chooses, results are often reported at the aggregate level – an all-for-one and one-for-all approach to Key Drivers Analysis. This assumes two key factors:
All customers want the same thing.
All customers mean the same thing.
An aggregate model takes the individuality of customers and distills it down to the “average” customer. But no customer is truly average. Every customer has unique needs, behaviors, and reasons that drive their experience with your brand, and it is those differences between individuals that reveal insights and opportunities that an aggregate KDA often obscures.
So, how do we bring individuality back into Key Drivers Analysis? Well, we need individual-level impacts for our key driver model (warning, a quick analytic detour to follow). To bring this to life, we have created a new approach based on the newest advances in machine-learning explainability. The protocol is scalable to many different predictive, key-driver techniques – from simple methods like regression, to more advanced machine-learning algorithms like Bayesian Network Analysis, random forests, and neural nets. It’s an explanatory approach that sits on top of whatever technique best fits a situation’s needs, but has the added benefit of providing individual-level impacts.
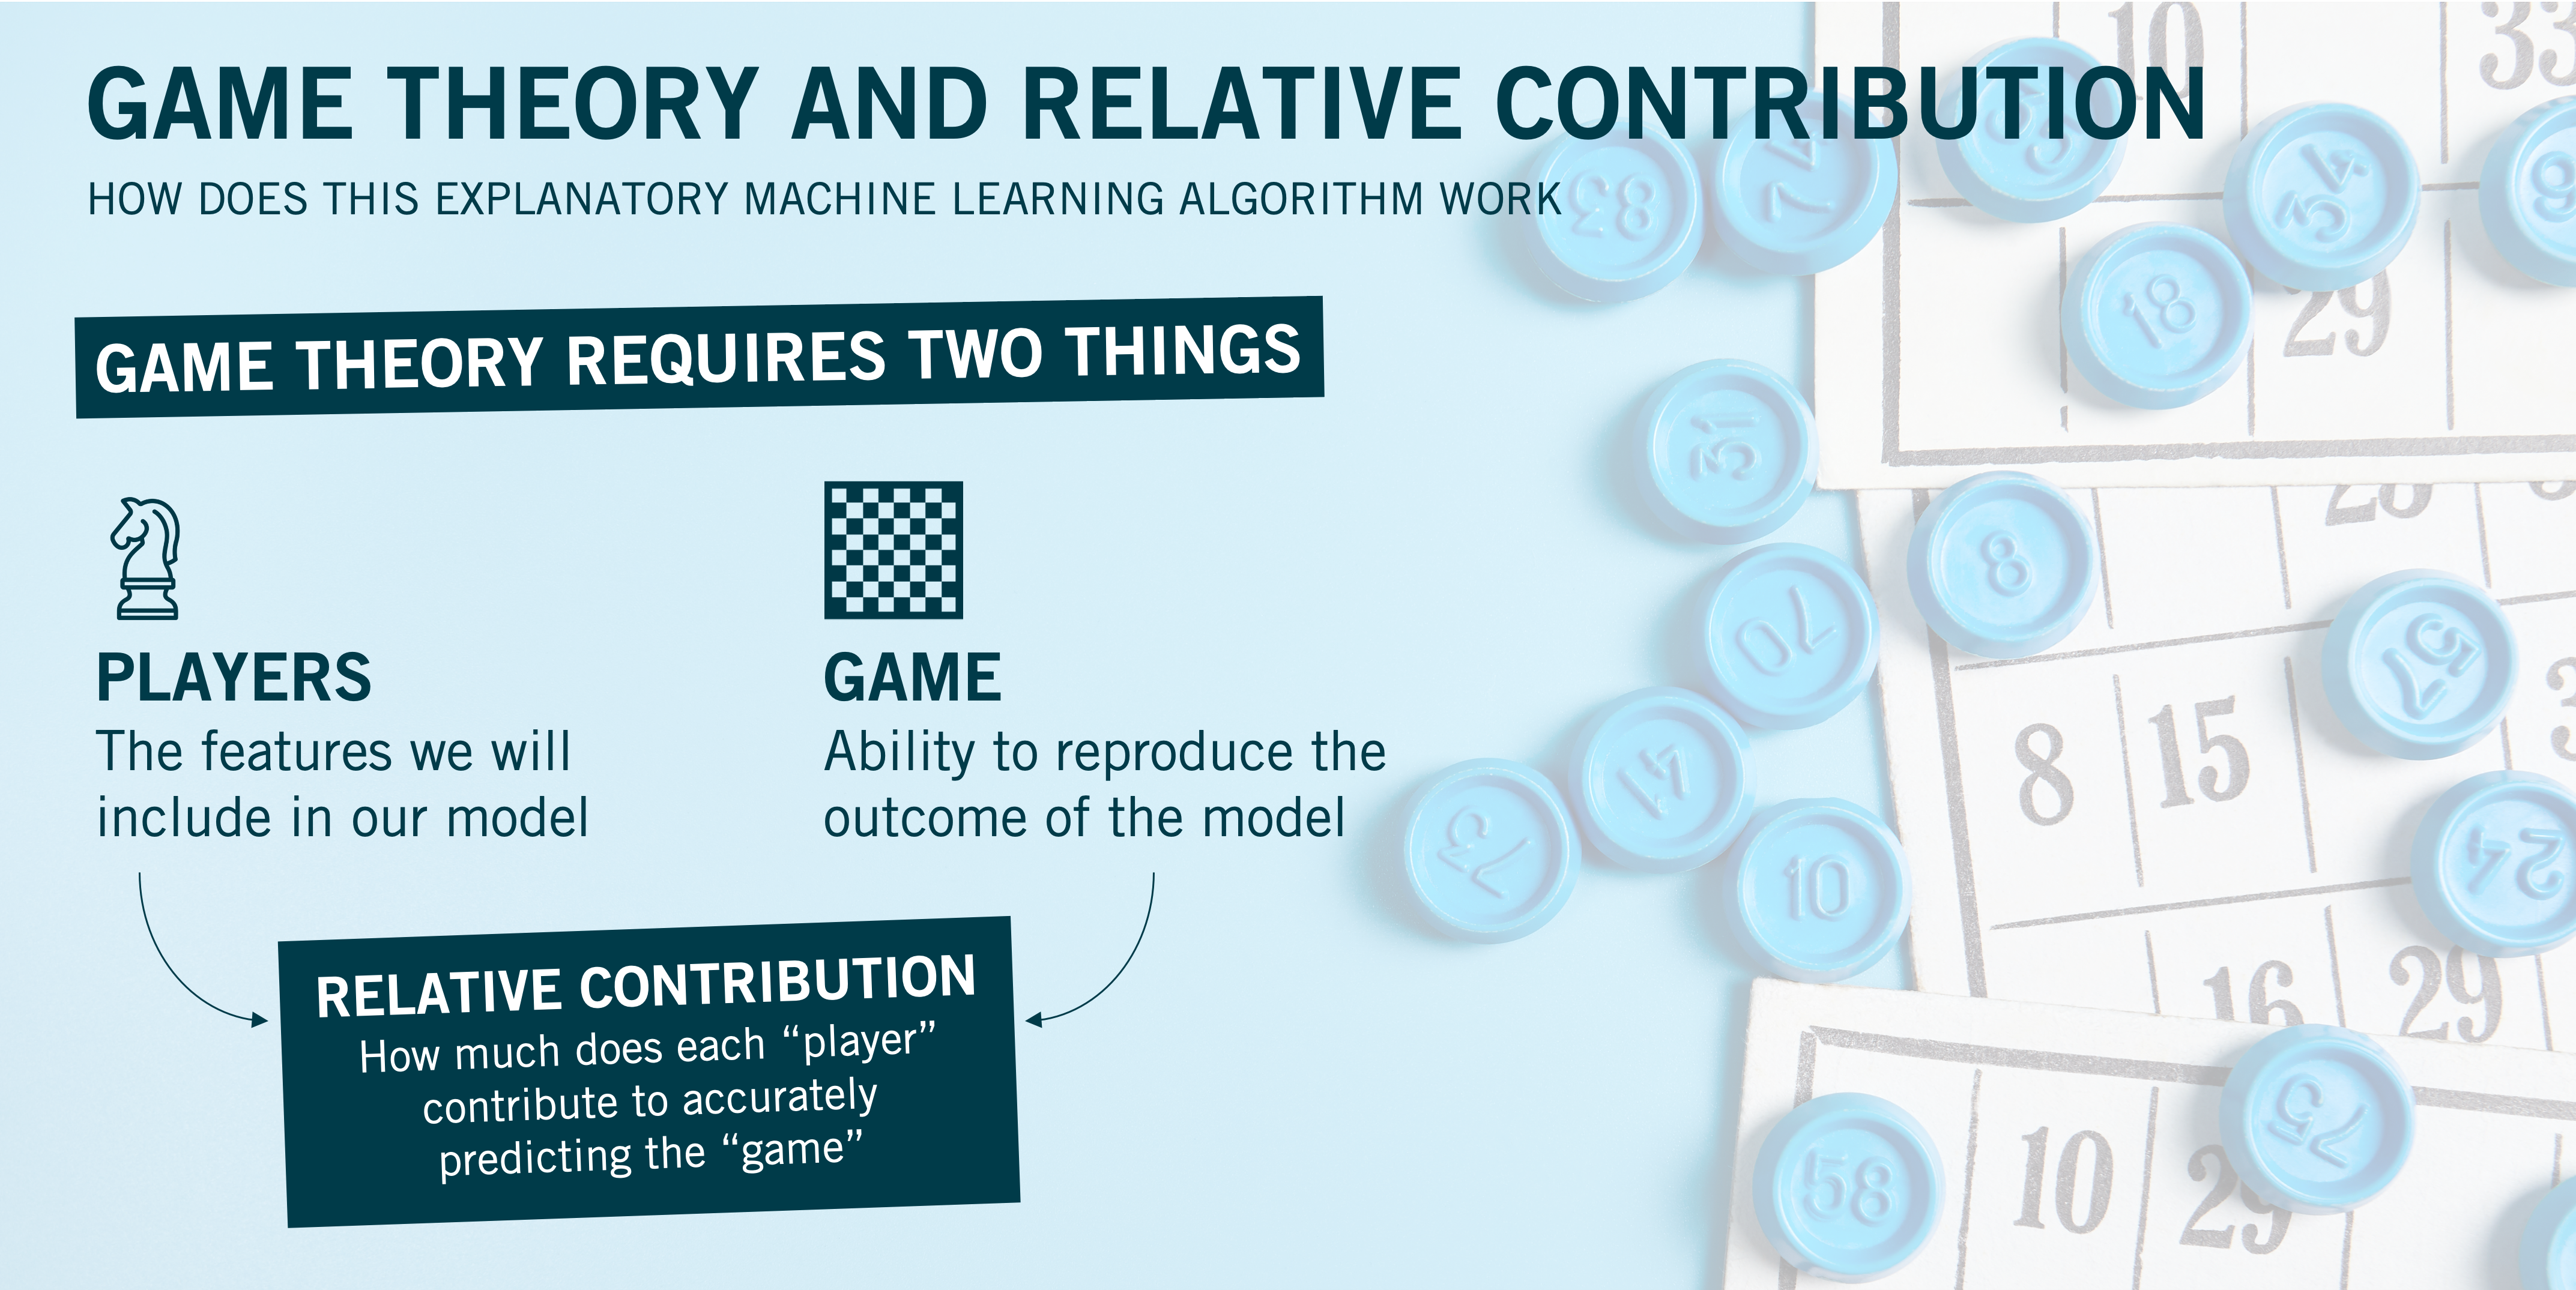
So how does it work? The concept is derived from game theory where we try to understand…
how much each player – the features or predictors included in the model – helps us to predict the game – a respondent’s predicted outcome in our model, let’s say through customer satisfaction or NPS, for example.
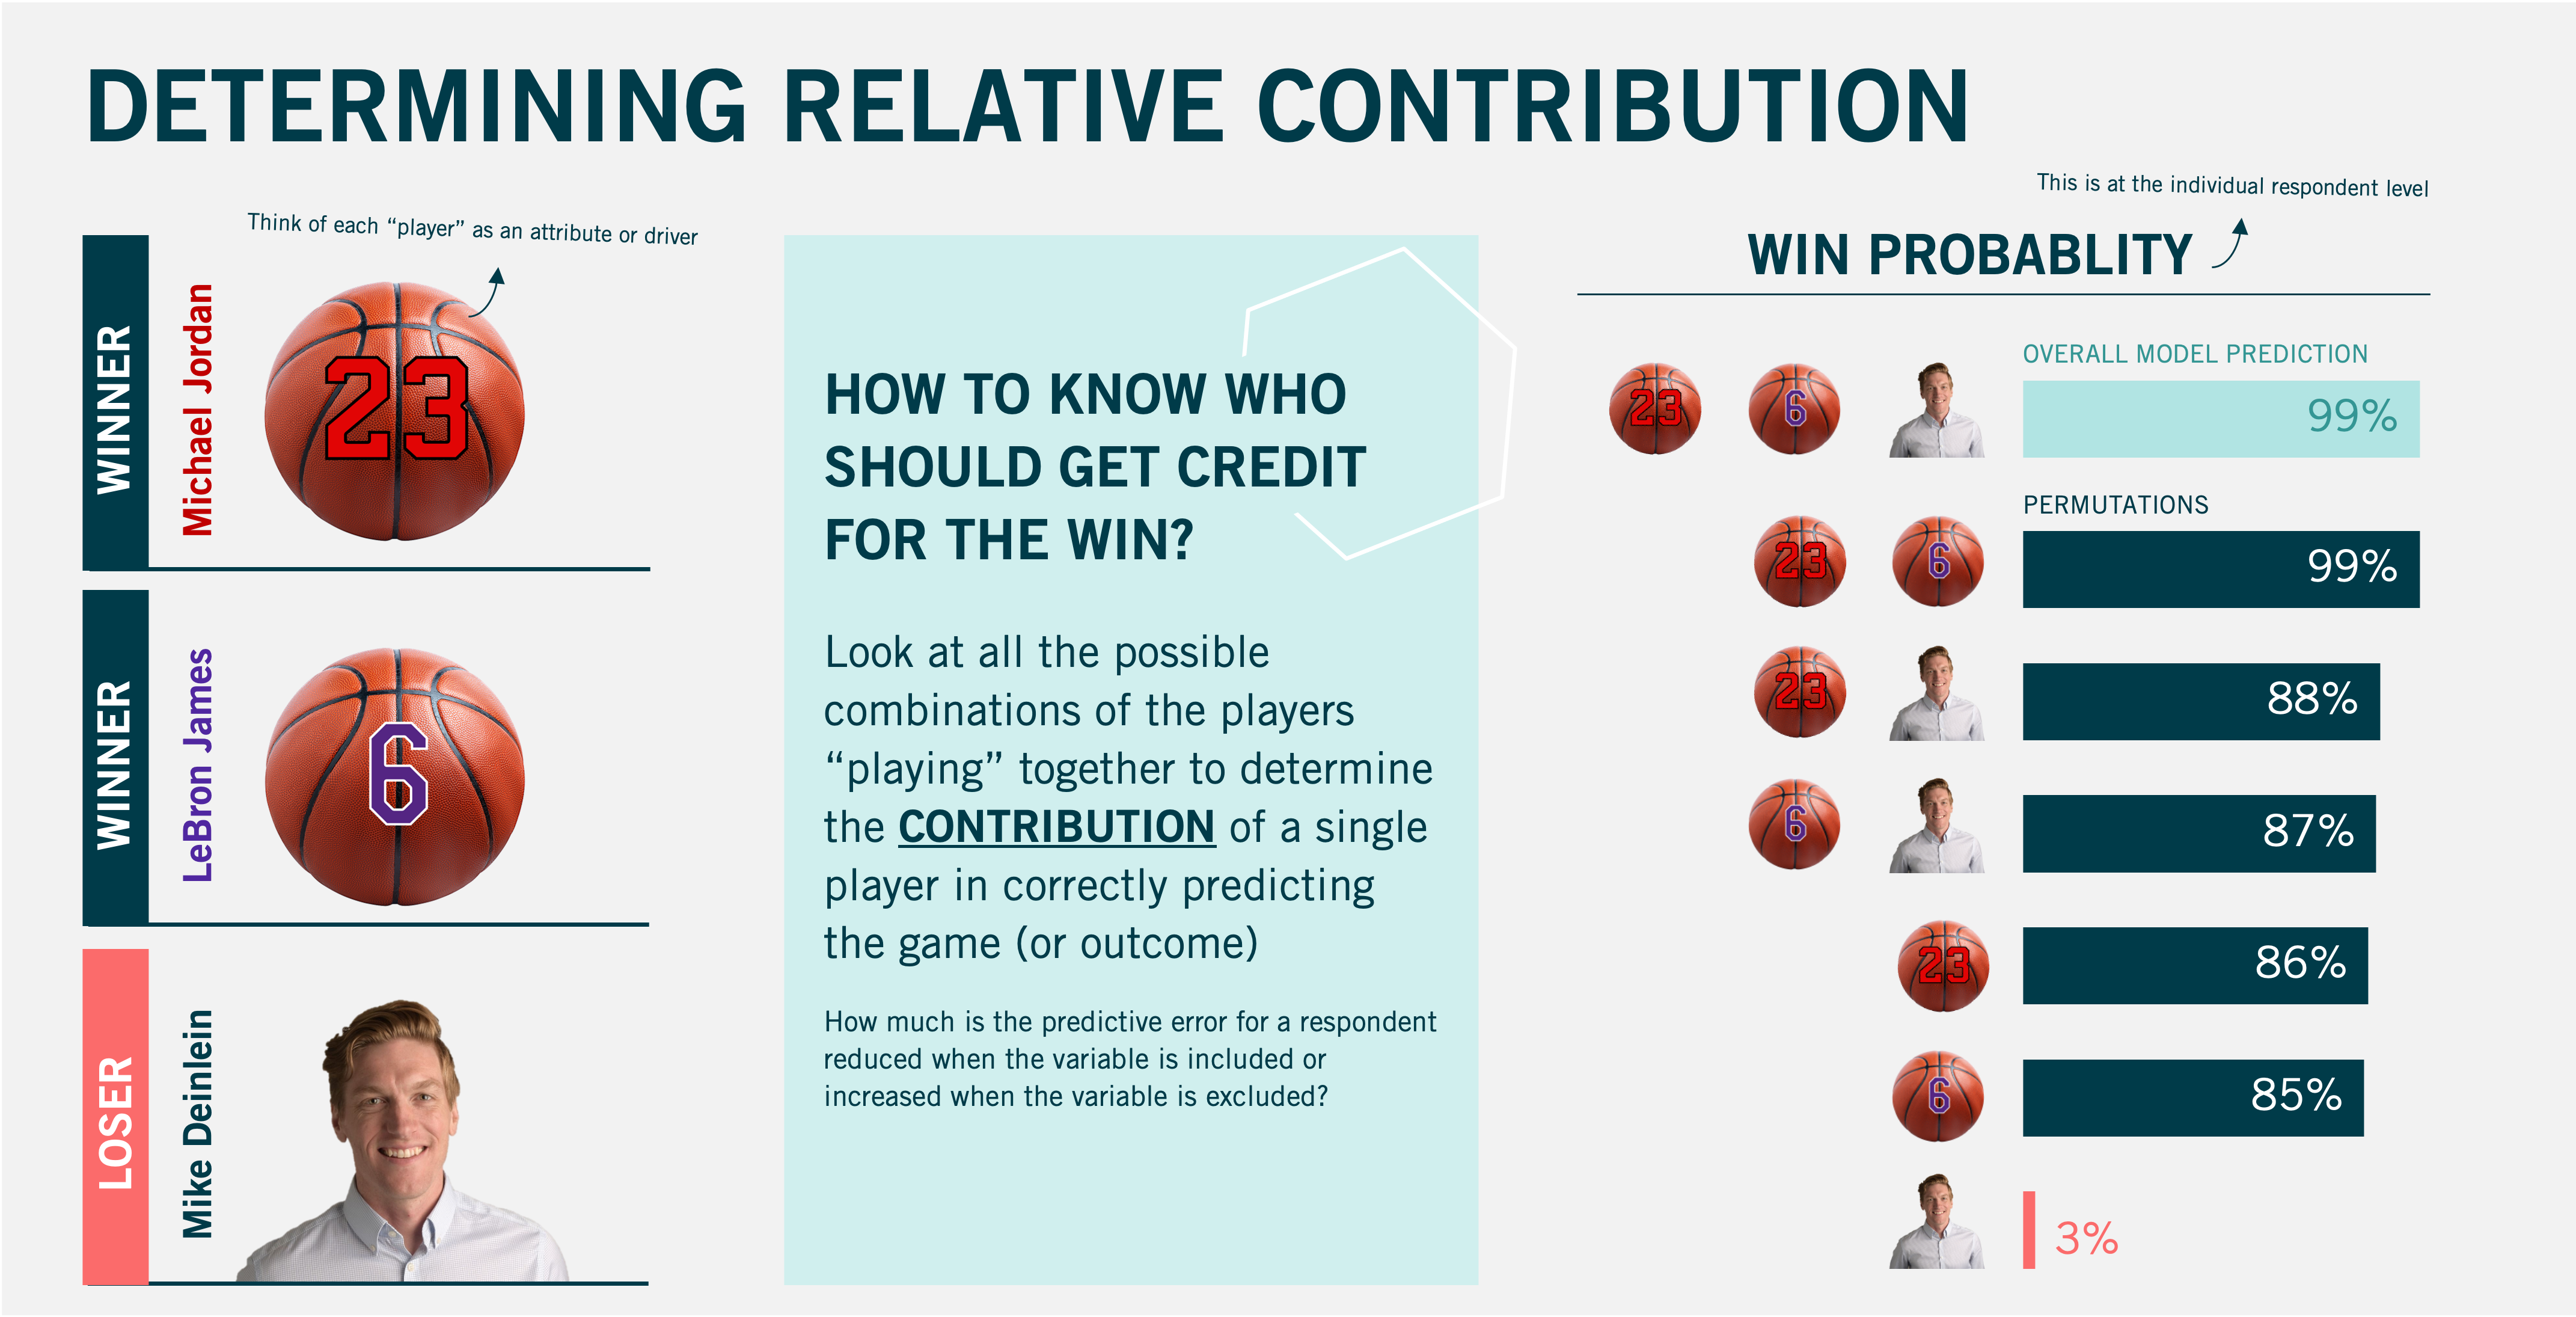
By running countless permutations where certain “players” are iteratively included or excluded from our model, we can assess how well the presence of a feature helps us predict our outcomes for each respondent, the “game” in our model. For example, perhaps cost savings is more critical in predicting Respondent A’s satisfaction, but digital experiences are more critical for predicting Respondent B’s satisfaction. We call this the “relative contribution,” and it provides the respondent-level impact we need to bring individuality back to our KDA.
This may sound complicated so let’s use an example to better illustrate the concept. Imagine there is a 3-on-3 basketball tournament, and the winning team includes Michael Jordan, LeBron James, and yours truly. The “relative contribution” likely isn’t equally distributed amongst these three individuals. This explanatory, machine-learning algorithm works by running all the different permutations of the three of us playing together to see who is driving our success. You can see on the right side of the graphic below that the overall model predicts we have a 99% chance to win when we all play together. When just Michael and LeBron play together… we still have a 99% chance to win. When I enter the equation, the predicted probability starts to fall off rather dramatically, all the way to when it is just me playing by my lonesome and we have just a 3% chance to win. This is to say that Michael and LeBron have a significantly higher “relative contribution” than I do when predicting the outcome of this game.
Now, this is an intentionally flippant example, and frankly, if we ran an aggregate KDA alongside this new approach, the results would likely align closely, as most people would prefer Michael and LeBron to me. But, perhaps (fingers crossed) my wife would prefer me to those two – or, maybe some respondents would prefer Michael to LeBron and, vice versa, others would prefer LeBron to Michael. However, that’s just it: those differences matter. A business should know who thinks LeBron is more important than Michael. Substitute “cost” and “digital experiences” for those two basketball superstars and imagine how impactful it would be when your business could understand which customers wanted one over the other.
Furthermore, once we get these individual-level impacts, we now have more ways to analyze our key-driver data. We can cut it by any subgroup to see if different demographics, lines of business, or risk profiles want different things from the business. We can even take those individual results and put them in a cluster analysis and create key-driver segments. All this flexibility gives you more ways to understand the momentum (or stagnation) of your key performance indicators. Maybe a core line of business is losing traction; now you can look at the unique key drivers, assess performance on the most important drivers, and create action plans that are tailored to that line of business. Maybe a key driver segmentation reveals that your digital engagement segment is relatively small but has a much higher churn likelihood than the other segments; resources can now be redirected to focus on the most important key drivers to stop customer exodus instead of hoping the aggregate key drivers will keep them loyal.
As I said at the beginning, there may not be a best technique for running key drivers, but there is a best approach. By incorporating respondent-level results, you can bring the individuality of your customers back into your Key Drivers Analysis and have more ways to assess changes in your key performance indicators, and ultimately, make the right investments to improve your customer experience.

Mike serves as VP, CX Solutions at Burke Inc. and consults with clients on agile CX technology use, the removal of customer data silos, and the effective utilization of integrated insights to drive better customer experiences for clients.
Interested in reading more? Check out Mike’s other articles:
What is Customer Experience (CX) Research?
Why Feedback From Customers Still Matters in CX Research
As always, you can follow Burke, Inc. on our LinkedIn, Twitter, Facebook and Instagram pages.
Source: Feature Image – ©filadendron – istockphoto.com


